
Reading the 66 Lottery Result Chart: Every Column Explained
Find the round history, understand each column and the trend view, and know exactly what the chart can and cannot tell you
Contents
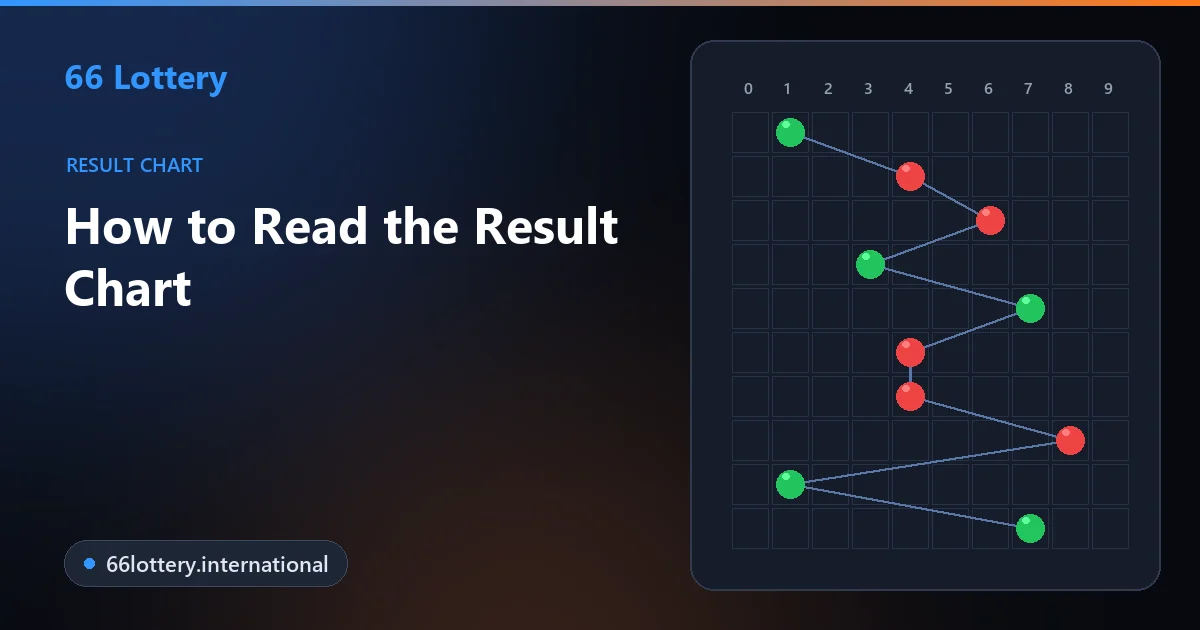
The result chart is the round history built into each game. Every row is one finished round: its period number, the digit it landed on, whether that digit counts as Big or Small, and its colour. A separate trend view plots the same numbers as dots so you can scan many rounds at once. It is a record of what happened — useful for checking your bets, useless for forecasting the next round.
Players of 66 Lottery often search for the “result chart” expecting a table on a website. The real chart lives inside the app and the website lobby, and you need to be signed in to compare it with your own bets. If you are not, the login steps take a minute.
18+ only · Past results do not predict future rounds.
Where the Chart Is
- 1Open the lobby and tap Wingo (the same idea applies to K3 and 5D).
- 2Choose the time mode at the top — each mode has its own separate history.
- 3Scroll below the colour, number and Big/Small buttons.
- 4Switch between the history tabs: the game’s full history, the chart or trend view, and your own bets.
Tab names differ slightly between app versions — you may see “Game history”, “Chart” and “My history”, or similar wording — but the layout is the same. A common mistake is reading the history of one time mode while betting in another. Always check that the mode highlighted at the top matches the one you played.
The History Table, Column by Column
Period
The round’s ID: a date followed by a running count. It is what you quote to support if you ever question a result, and it lets you match a bet in your own history to the round it was placed on.
Number
The digit the round landed on, from 0 to 9. Everything else in the row is worked out from this one number.
Big / Small
In the standard Wingo layout, 5 to 9 count as Big and 0 to 4 as Small. The game’s How to Play screen confirms the split for the mode you are in.
Colour
A dot or two dots in green, red or violet. Most numbers have one colour; 0 and 5 show two because they are shared with violet.
Because the number decides everything else, you can read a row from left to right as a single fact: “in this period the draw was 7, which is Big and green.” Two rows can never disagree with each other on Big or colour for the same digit. The full number-to-colour map, including why 0 and 5 carry two colours, is in the green, red and violet guide.
Reading the Trend Tab
The trend or chart tab turns the same history into a grid. Each row is a period and each column is a digit from 0 to 9; the winning digit is marked with a coloured dot, and a line joins the dots from one round to the next. It is simply a faster way to look at many rounds — the zig-zag shows how the number jumped around.
Many versions add a small block of statistics above the grid for a recent window of rounds. Labels such as “missing” (rounds since a number last appeared), “frequency” (how often it appeared in the window) and “max consecutive” (its longest run) are common. They are accurate descriptions of the past window and nothing more.
K3 and 5D have their own versions of the chart. K3 records three dice and their total; 5D records five digits in separate positions. The principle is identical: a log of finished rounds.
Your Own Bet History
The most practical use of the chart is checking your own play. Your personal history lists each bet with its period number, what you picked, the amount and whether it won. To confirm a settlement, take the period number from your bet and find the same period in the game history. The digit there decides the outcome.
If something does not add up — a bet missing, or a result that seems to contradict the history — screenshot both rows, including the period numbers, before the history scrolls on. Send them through the official channels on the customer care page. A period number is the one detail support needs to look up any round.
What the Chart Cannot Tell You
It is tempting to look at a chart where 3 has not appeared for many rounds and feel that 3 must be close. That feeling has a name — the gambler's fallacy — and it is wrong for any game where rounds are independent. The next draw has no memory of the last one. A long gap is just what randomness looks like over a short window.
The same goes for streaks. Five Bigs in a row does not make Small more likely, and it does not make Big more likely either. Tools and groups that sell “patterns” from the chart are covered in do prediction hacks work? The broader results overview is on the results page.
About “Result Today” Searches
Unlike a state lottery with one draw a day, these games run round after round, so there is no single result of the day to publish. Websites that post a “66 lottery result today” table are either copying a few rows from somebody's screen or inventing them. The in-game history is the only record that matters, and it is always up to date the moment a round closes.
Play Responsibly
Watching the chart can turn a short session into a long one. Set a budget and a time limit first, and stop when either runs out. Support and tools are on the responsible gaming page. For adults aged 18 and over only.
Result Chart — FAQs
Inside each game. Open Wingo (or K3 or 5D), pick the time mode, and scroll below the betting buttons. The history tabs there show past rounds and, in most versions, a separate chart or trend tab.
No. These are continuous games with a new round every short interval, so a day contains hundreds of results per mode. Pages that post a single “today’s result” are not showing the game’s record; the in-game history is the only source.
No. The chart is a record of rounds that have already happened. Each new round is independent, so a number that has not appeared for a while is no more likely to appear next.
Where it is shown, it counts how many rounds have passed since a number last appeared. It describes the past only; a high missing count does not make that number due.
Find the bet in your own history, note its period number, then find the same period in the game history and compare. If they do not match, send both screenshots to customer care.
You can often see the lobby without logging in, but your own bet history always needs a signed-in account, and some versions only show the full game history after login.
See It Without Risk
The free Wingo demo builds its own history as you play with pretend money — a quick way to see how random a real chart looks.
More guides